
EU shipping emissions rose in 2025. The ships did not emit more. The reported increase comes entirely from vessels that entered the reporting rules in 2025; follow the same ships through both years and emissions fell. Below the CO₂ line, methane rose sharply as LNG dual fuel ships reached the water, and from 2026 that methane becomes billable, pushing the maritime EU ETS bill toward 100 million allowances. For owners and charterers, the headline MRV number is only the starting point. The exposure sits behind it.
MRV is one of the few public records available at the vessel level, and emission analysts increasingly lean on it when reconciling EU ETS and FuelEU exposure. Even though it is not a complete dataset several points can be established here.
In those points the following would be the key ones:
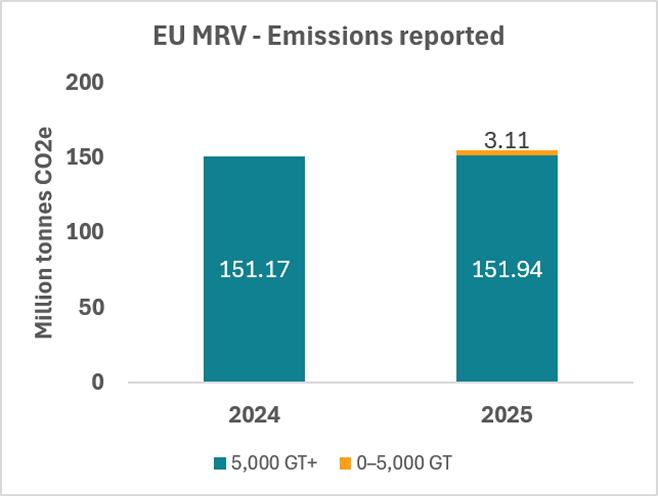
Reported CO₂ rose 2.2 % to 150.4 million tonnes, or 2.6 % on a CO₂e basis. The rise comes entirely from ship categories that entered the reporting rules in 2025. Set them aside and emissions fell 1.5 %. Follow the same ships through both years and they fell 3.4 %. The movement that matters sits below the CO₂ line: methane rose 30.5 % as the LNG dual fuel orderbook reached the water, and a bounded biofuel-blend signal appeared for the first time.
From 1 January 2025, MRV expanded to general cargo ships of 400 to below 5,000 GT and offshore vessels: the coasters and supply ships that have always worked European waters, are now on the public record. These categories account for about 1,783 records and 5.55 million tonnes of CO₂ (5.65 Mt CO₂e). The entire 2024-to-2025 increase was 3.28 million tonnes. Remove the new categories and 2025 lands at 144.9 Mt, 1.5 % below 2024 (1.2 % below on CO₂e).
A caution before this is booked as progress: MRV counts EU-related voyages only. A ship can report less by calling in Europe less often, changing trade, slowing down, improving, or leaving. The file records the outcome, not the reason.
And the perimeters differ by regulation. Large offshore ships enter the EU ETS only from 2027. FuelEU applies above 5,000 GT to passenger and cargo ships. And biofuels that carry near-fossil factors in MRV can be zero-rated in the ETS.Same database, different regulation, different bill.
The 9,955 ships that reported emissions in both years (zero-fuel filings excluded) cut EU-scope CO₂ from 127.9 to 123.5 Mt, down 3.4 % , and 3.1 % on CO₂e. On CO₂e, containers fell 6.6 %, bulkers 4.8, tankers 2.7.
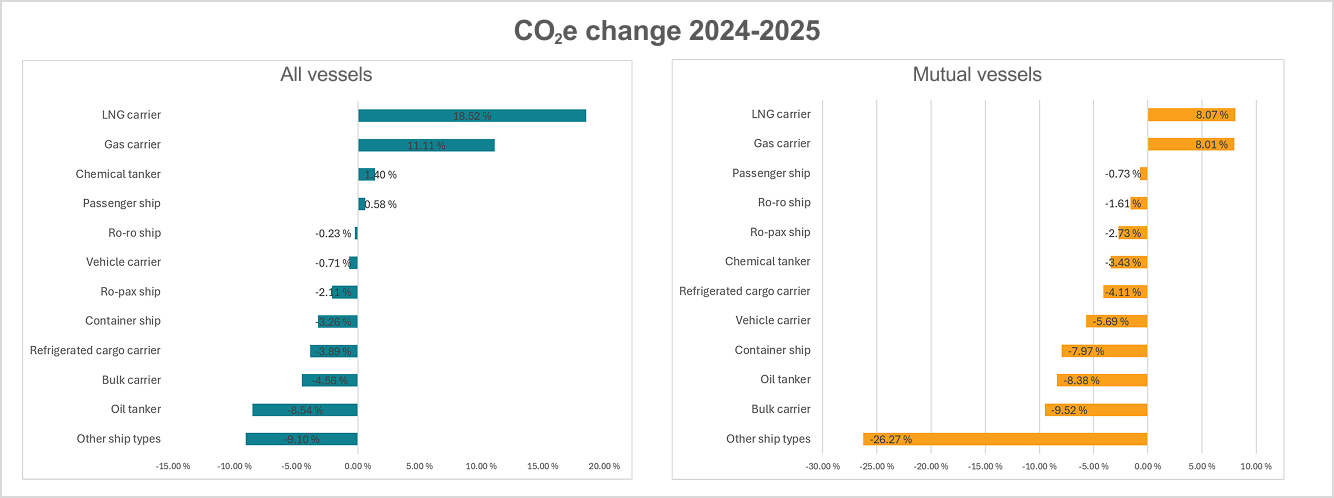
The ingredients are visible in the data: the matched container ships spent 2.2% less time at sea in EU scope and consumed 4.7 % less fuel per unit time spent, consistent with slower steaming, soft European demand, and the roughly 500 container ships that entered the MRV file in 2025. A partial return to Suez routing during 2025 would also shorten reported voyages against a fully diverted 2024. We do also noticed the decline in emission from oil tanker and an increase in LNG vessel emissions consistent with lower EU oil imports and higher LNG imports over the year.
None of this can be separated from genuine efficiency ship by ship. Treat it as a like-for-like reporting result, not an efficiency certificate.
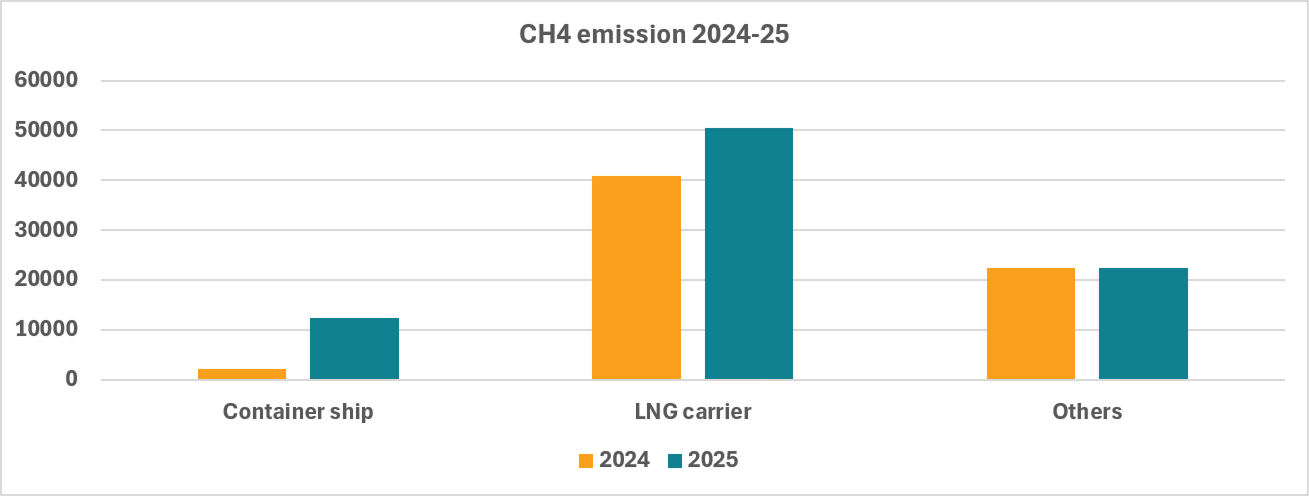
Methane rose 30.5 %, from 65,398 to 85,373 tonnes, and it sits in two places: container ships added 10.19 kt (2.24 to 12.42, more than fivefold) and LNG carriers 9.63 kt. The rest of the fleet added 0.16 kt. That container jump reflects the LNG dual fuel newbuildings delivered over 2024 and 2025. Methane slip was a conference topic for years; it is now a column in a public spreadsheet.
The commercial consequence is already visible on LNG carriers: 9.83 Mt of CO₂ against 11.35 Mt of CO₂e, a 15.6 % uplift in aggregate, with a vessel median of 18.7 % and a 90th percentile of 30.1. From 2026 both CH4 and N2O are added to the maritime EU ETS scope, in the same year the phase-in reaches 100 %, so this gap becomes an allowance line.
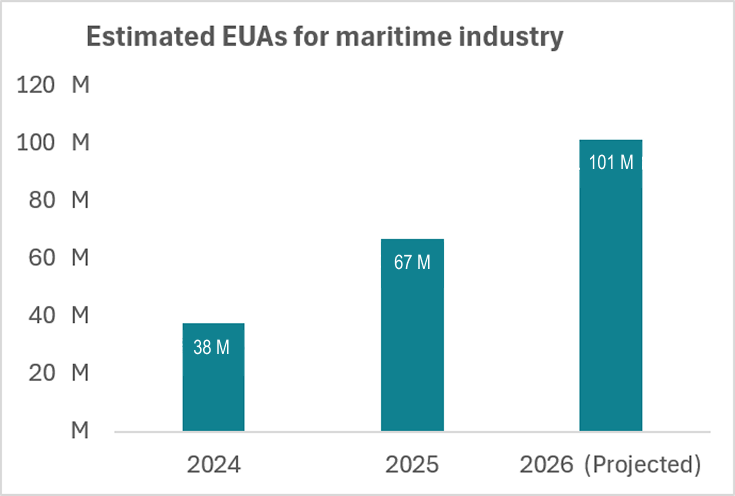
If we project the EUA for 2026, maritime industry would require close to 100 million allowances, roughly 8 % of the 2026 EU ETS cap of about 1,185 million.
It needs to be noted that this ignores the effect of Biofuels and thus only gives a rough estimation on the totals.
However what is clear is Maritime EUA pot will be noticing a significant increase and might come to contribute close to 8 % of the EU ETS cap, which in itself is shrinking.
The ETS covers intra-EU voyages and port emissions at 100 % and voyages to or from non-EU ports at 50%. Applied mechanically, about 65.5 % of reported CO₂ is route-scoped; the file's own Directive field says 87.9 Mt, or 58.4 %. The gap reflects derogations, and records with no current ETS obligation. Neither number is an allowance invoice without vessel and fuel -level reconciliation.
What is unambiguous is how unevenly the burden falls. The share of emissions reported in MRV and then passed to ETS (excluding biofuels effect) would vary across different vessel types as per the figures below.
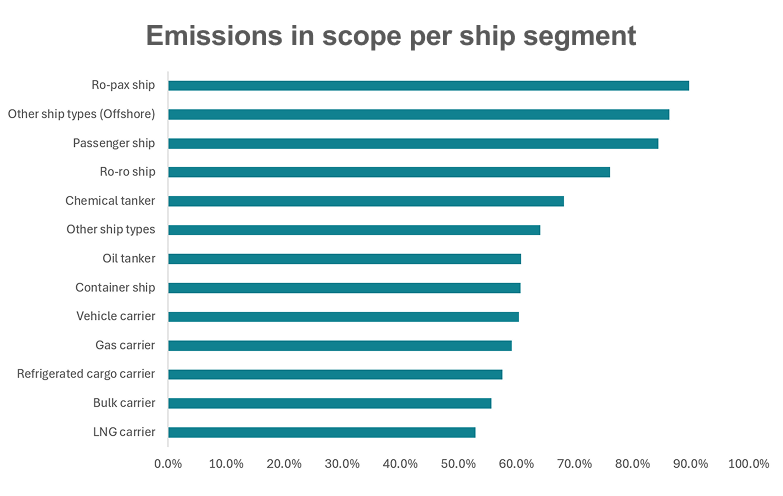
The ferry and short-sea segments carrying full ETS exposure also sit fully inside the FuelEU target.
The headline rose because the reporting population grew. The comparable fleet fell on both CO₂ and CO₂e. Methane became visible at scale, and from 2026 it is billable. The discipline for owners and charterers is to keep four ledgers separate:
The market will quote 150.4 million tonnes. The number is public. The exposure still has to be built.

EU shipping emissions rose in 2025. The ships did not emit more. The reported increase comes entirely from vessels that entered the reporting rules in 2025; follow the same ships through both years and emissions fell. Below the CO₂ line, methane rose sharply as LNG dual fuel ships reached the water, and from 2026 that methane becomes billable, pushing the maritime EU ETS bill toward 100 million allowances. For owners and charterers, the headline MRV number is only the starting point. The exposure sits behind it.
MRV is one of the few public records available at the vessel level, and emission analysts increasingly lean on it when reconciling EU ETS and FuelEU exposure. Even though it is not a complete dataset several points can be established here.
In those points the following would be the key ones:
Reported CO₂ rose 2.2 % to 150.4 million tonnes, or 2.6 % on a CO₂e basis. The rise comes entirely from ship categories that entered the reporting rules in 2025. Set them aside and emissions fell 1.5 %. Follow the same ships through both years and they fell 3.4 %. The movement that matters sits below the CO₂ line: methane rose 30.5 % as the LNG dual fuel orderbook reached the water, and a bounded biofuel-blend signal appeared for the first time.
From 1 January 2025, MRV expanded to general cargo ships of 400 to below 5,000 GT and offshore vessels: the coasters and supply ships that have always worked European waters, are now on the public record. These categories account for about 1,783 records and 5.55 million tonnes of CO₂ (5.65 Mt CO₂e). The entire 2024-to-2025 increase was 3.28 million tonnes. Remove the new categories and 2025 lands at 144.9 Mt, 1.5 % below 2024 (1.2 % below on CO₂e).
A caution before this is booked as progress: MRV counts EU-related voyages only. A ship can report less by calling in Europe less often, changing trade, slowing down, improving, or leaving. The file records the outcome, not the reason.
And the perimeters differ by regulation. Large offshore ships enter the EU ETS only from 2027. FuelEU applies above 5,000 GT to passenger and cargo ships. And biofuels that carry near-fossil factors in MRV can be zero-rated in the ETS.Same database, different regulation, different bill.
The 9,955 ships that reported emissions in both years (zero-fuel filings excluded) cut EU-scope CO₂ from 127.9 to 123.5 Mt, down 3.4 % , and 3.1 % on CO₂e. On CO₂e, containers fell 6.6 %, bulkers 4.8, tankers 2.7.
The ingredients are visible in the data: the matched container ships spent 2.2% less time at sea in EU scope and consumed 4.7 % less fuel per unit time spent, consistent with slower steaming, soft European demand, and the roughly 500 container ships that entered the MRV file in 2025. A partial return to Suez routing during 2025 would also shorten reported voyages against a fully diverted 2024. We do also noticed the decline in emission from oil tanker and an increase in LNG vessel emissions consistent with lower EU oil imports and higher LNG imports over the year.
None of this can be separated from genuine efficiency ship by ship. Treat it as a like-for-like reporting result, not an efficiency certificate.
Methane rose 30.5 %, from 65,398 to 85,373 tonnes, and it sits in two places: container ships added 10.19 kt (2.24 to 12.42, more than fivefold) and LNG carriers 9.63 kt. The rest of the fleet added 0.16 kt. That container jump reflects the LNG dual fuel newbuildings delivered over 2024 and 2025. Methane slip was a conference topic for years; it is now a column in a public spreadsheet.
The commercial consequence is already visible on LNG carriers: 9.83 Mt of CO₂ against 11.35 Mt of CO₂e, a 15.6 % uplift in aggregate, with a vessel median of 18.7 % and a 90th percentile of 30.1. From 2026 both CH4 and N2O are added to the maritime EU ETS scope, in the same year the phase-in reaches 100 %, so this gap becomes an allowance line.
If we project the EUA for 2026, maritime industry would require close to 100 million allowances, roughly 8 % of the 2026 EU ETS cap of about 1,185 million.
It needs to be noted that this ignores the effect of Biofuels and thus only gives a rough estimation on the totals.
However what is clear is Maritime EUA pot will be noticing a significant increase and might come to contribute close to 8 % of the EU ETS cap, which in itself is shrinking.
The ETS covers intra-EU voyages and port emissions at 100 % and voyages to or from non-EU ports at 50%. Applied mechanically, about 65.5 % of reported CO₂ is route-scoped; the file's own Directive field says 87.9 Mt, or 58.4 %. The gap reflects derogations, and records with no current ETS obligation. Neither number is an allowance invoice without vessel and fuel -level reconciliation.
What is unambiguous is how unevenly the burden falls. The share of emissions reported in MRV and then passed to ETS (excluding biofuels effect) would vary across different vessel types as per the figures below.
The ferry and short-sea segments carrying full ETS exposure also sit fully inside the FuelEU target.
The headline rose because the reporting population grew. The comparable fleet fell on both CO₂ and CO₂e. Methane became visible at scale, and from 2026 it is billable. The discipline for owners and charterers is to keep four ledgers separate:
The market will quote 150.4 million tonnes. The number is public. The exposure still has to be built.


