April 11, 2023
The article series "How a CII approach to chartering can increase emissions and cost" presents common voyage examples highlighting the sometimes unfortunate correlation between CII rating, absolute emissions and carbon cos. In this example we take a closer look at thee potential ships for an MR voyage, transporting CPP from Rotterdam to La Coruna, comparing voyage CII to absolute emissions.
The best way to understand the consequences of day-to-day chartering decisions is to zoom in on single voyages. So, to help our customers understand how their chartering decisions impact the CII, we developed the Voyage CII. The Siglar Carbon Ship Finder displays both the voyage CII rating and absolute emissions from potential ships so that unintended consequences of a CII approach to chartering are highlighted.
Comparing three potential ships for an MR voyage highlights how a ship with CII rating A can emit almost 4 times more CO2 than a ship with rating B and almost 3 times more than a ship with rating D.
.webp)
The above example is made from a spot charterer looking to load 37000 tonnes of CPP in Rotterdam, discharging in La Coruna between 11-25 November 2022. The Siglar Ship Finder located 61 potential ships. Ranking the ships by absolute emissions resulted in the below list, where the three ships are highlighted to exemplify how the CII rating does not always reflect absolute emissions.
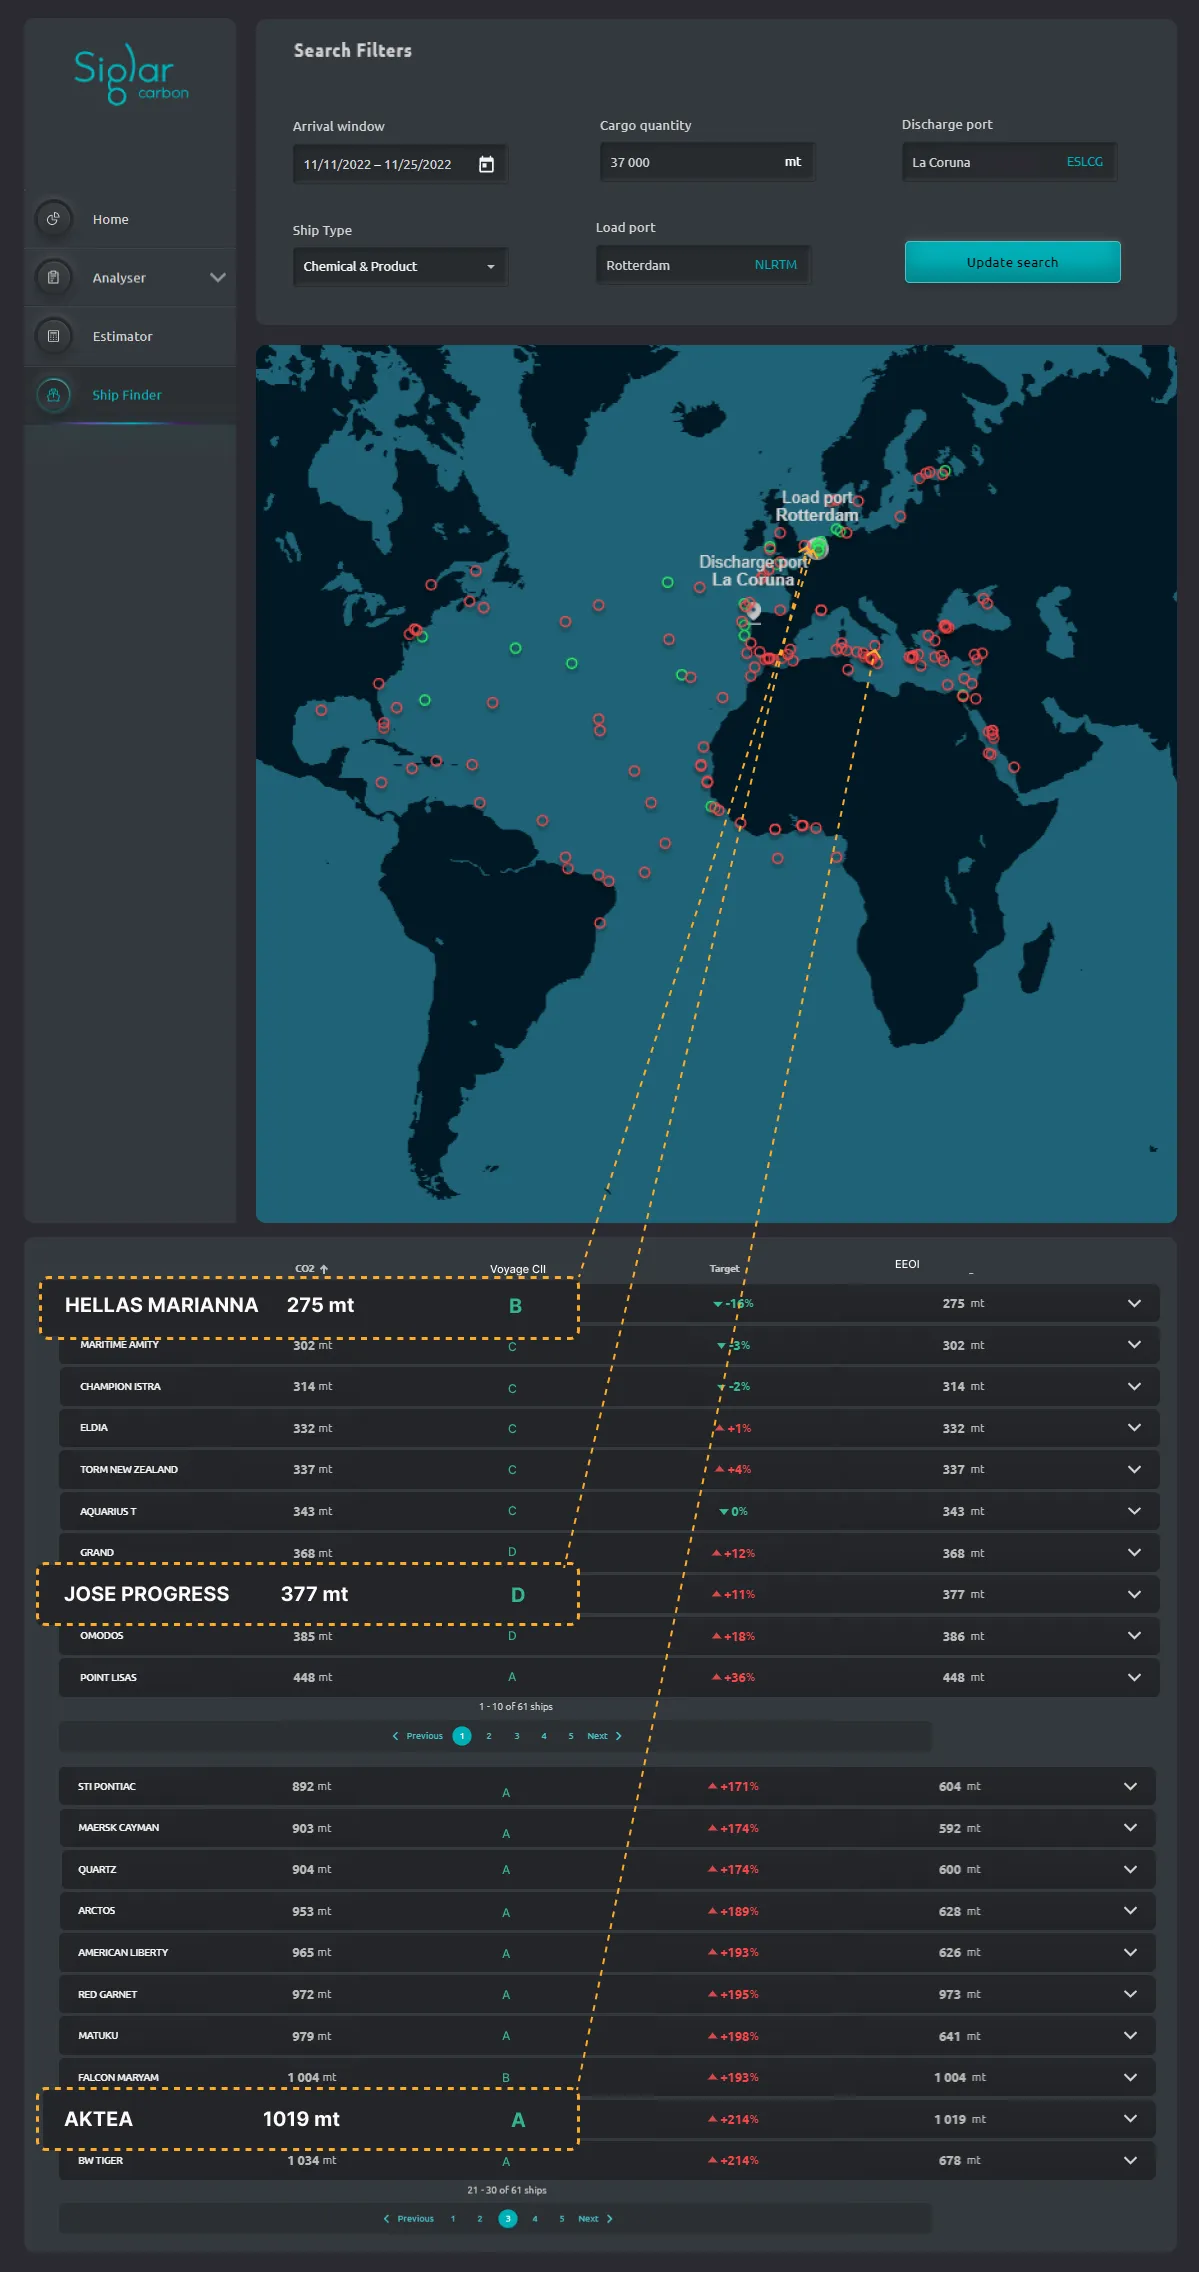
The most carbon efficient ship is a newer ship located in Rotterdam. With no ballast leg emissions included, it is expected to emit 275 tonnes of CO2 from discharge to discharge. However, the ship gets a voyage CII rating B because it is a short haul voyage with no ballast leg.
The ship ranked number 8 is expected to emit 377 tonnes However, ship number 29 on the absolute emissions ranking getsof CO2 on the voyage. It is an older ship doing a short haul voyage with no ballast, and the voyage CII rating is D.
Ship number 29 on the absolute emissions ranking does however get the voyage rating A. This is an older ship, but the relatively long voyage from Taranto Italy with no cargo is rewarded in the AER calculations and is why this ship gets a top CII rating.
See the example where we compare voyage CII to EU ETS carbon cost on an MR voyage.
Go back to the full story with all examples.
The article series "How a CII approach to chartering can increase emissions and cost" presents common voyage examples highlighting the sometimes unfortunate correlation between CII rating, absolute emissions and carbon cos. In this example we take a closer look at thee potential ships for an MR voyage, transporting CPP from Rotterdam to La Coruna, comparing voyage CII to absolute emissions.
The best way to understand the consequences of day-to-day chartering decisions is to zoom in on single voyages. So, to help our customers understand how their chartering decisions impact the CII, we developed the Voyage CII. The Siglar Carbon Ship Finder displays both the voyage CII rating and absolute emissions from potential ships so that unintended consequences of a CII approach to chartering are highlighted.
Comparing three potential ships for an MR voyage highlights how a ship with CII rating A can emit almost 4 times more CO2 than a ship with rating B and almost 3 times more than a ship with rating D.
The above example is made from a spot charterer looking to load 37000 tonnes of CPP in Rotterdam, discharging in La Coruna between 11-25 November 2022. The Siglar Ship Finder located 61 potential ships. Ranking the ships by absolute emissions resulted in the below list, where the three ships are highlighted to exemplify how the CII rating does not always reflect absolute emissions.
The most carbon efficient ship is a newer ship located in Rotterdam. With no ballast leg emissions included, it is expected to emit 275 tonnes of CO2 from discharge to discharge. However, the ship gets a voyage CII rating B because it is a short haul voyage with no ballast leg.
The ship ranked number 8 is expected to emit 377 tonnes However, ship number 29 on the absolute emissions ranking getsof CO2 on the voyage. It is an older ship doing a short haul voyage with no ballast, and the voyage CII rating is D.
Ship number 29 on the absolute emissions ranking does however get the voyage rating A. This is an older ship, but the relatively long voyage from Taranto Italy with no cargo is rewarded in the AER calculations and is why this ship gets a top CII rating.
See the example where we compare voyage CII to EU ETS carbon cost on an MR voyage.
Go back to the full story with all examples.
